Simply Explained: Datadog

Datadog In a Nutshell
- Cloud computing leads to software applications favoring distributed cloud infrastructure. This means that your infrastructure is spread amongst thousands of hosts and servers making monitoring a nightmare.
- Engineers write code, and the operations team maintains the code in production. When something goes wrong, such as the software application crashing, who is to blame? Both teams don’t have a shared language or toolset to monitor the health of the system.
- Datadog monitors your technical infrastructure. It provides a unified view across all your data sources and gives DevOps teams a common toolset and language to monitor the system. Datadog also prevents and helps resolve issues when they arise by sending alerts or providing additional info on the problem.
Cloud Computing and Digital Transformation
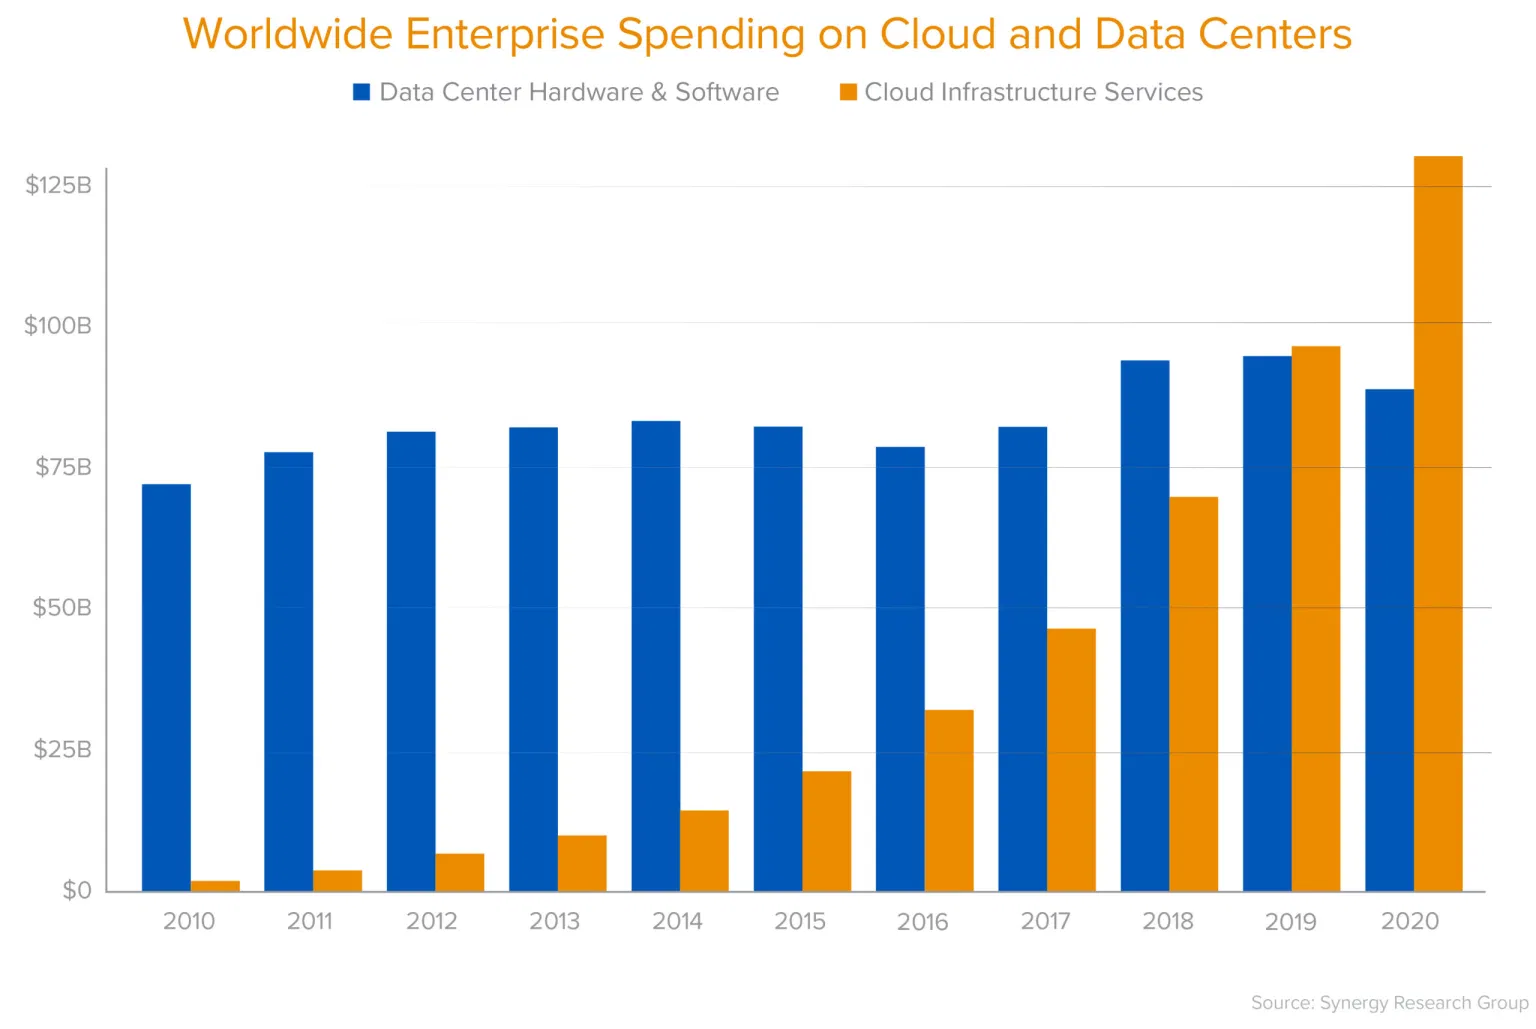
Cloud is one of the most significant platform shifts in the history of computing. The value proposition is infrastructure immediately at exactly the scale you need it. For example, say you’re running an ecommerce website and you’re expanding service to Europe. Before, you’d need to purchase a server and set it up in your network. Today, with the help of cloud solutions, you can just purchase an online server instantly through the cloud at the scale you need with minimal setup. This is economically and operationally efficient.
This saw new players and incumbents alike switching from legacy IT systems to Cloud Infrastructure birthing a new wave of software known as Software as a Service (SaaS). Now, software is continuously available and code can be deployed everywhere immediately. This shift to cloud distributed systems means that one application can use thousands of different containers and microservices, each one emitting its own data. Thousands of different data sources makes monitoring a cloud application a nightmare.
The DevOps Movement
Historically, engineers wrote code and operations teams made sure the code ran properly. These two teams were kept separate. The engineers would build applications and throw it over the fence to operations who were responsible for the code running in production. There was friction between these two teams. When the website performance was slow for the user was it the engineer’s code or the operations team’s infrastructure to blame? There wasn’t a common set of tools or metrics to monitor the health of the system; they were both speaking different languages.
What Does Datadog Do?
Datadog monitors your technical infrastructure. If your app crashes or a user can’t use your software, this is a huge problem and needs to be resolved immediately. Datadog helps prevent and resolve these issues.
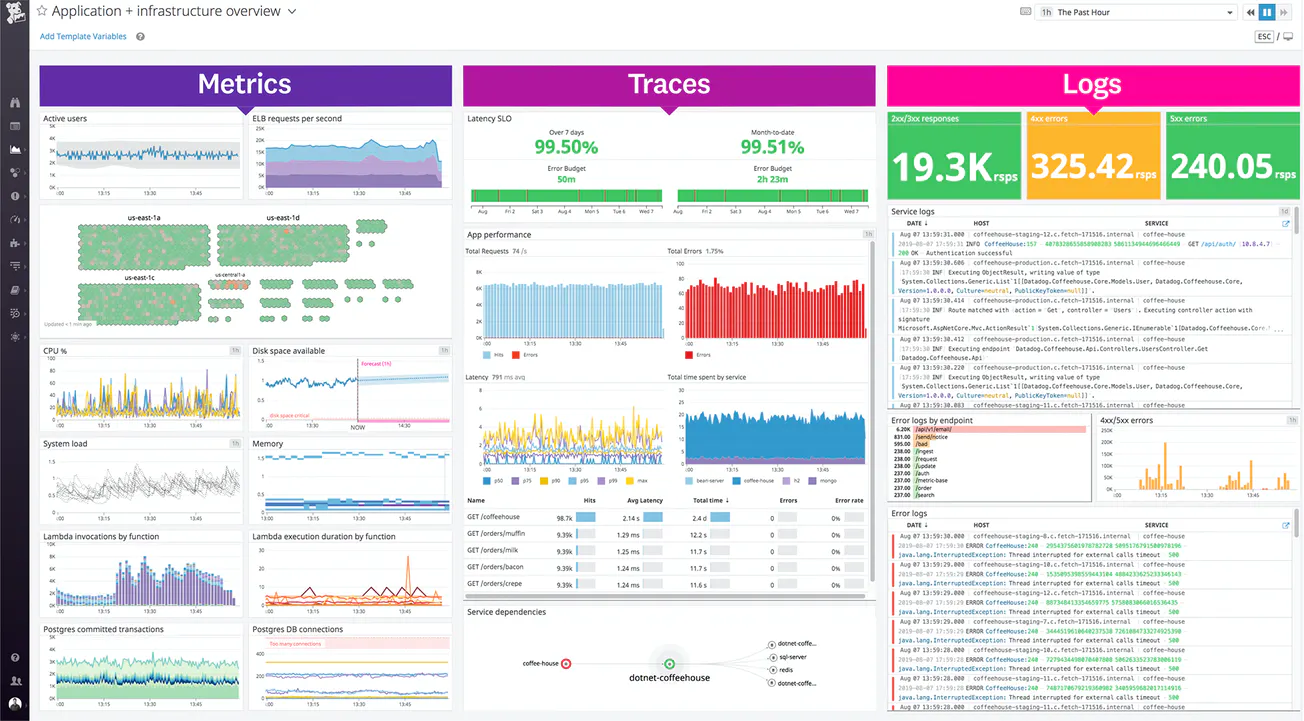
Datadog consolidates data from across your entire technical stack consisting of thousands of hosts and servers into a single pane view that’s easy for engineers, operations, and business analysts to understand. This gives a unified view across your tech stack and a common language and tool for everyone to monitor the health of the tech stack.
Datadog’s Products
A system is said to be fully observable if it monitors metrics, logs, and traces; the three pillars of observability [1]. Datadog’s product is a fully observable software solution that launched its first product, Infrastructure Monitoring, in 2012.
Infrastructure Monitoring (2012) Datadog’s flagship product. It monitors all the technology below the application layer. For example, it can monitor disk and CPU usage and send an alert to your team if any metric is outside the acceptable range. It also gives you a birds eye view of your entire infrastructure.
Application Performance Monitoring (2017) Application Performance Monitoring (APM) measures data related to the software application. The end goal of performance monitoring is to provide users with a high quality experience. APM can measure the performance of your code, the performance of your app when there’s high traffic, and it can check for broken links, amongst many other features.
Logs Management (2018) Event logs are structured data with a timestamp created by your application. For instance, many user actions create a log: password change, login, login failures, renaming a file, etc. These logs show you what happened behind the scenes in case something goes wrong. Logs can also be used to derive insights such as the usability. Log Management is a tool that aggregates, parses, stores, and analyzes your logs in order to gain insights from them.
What’s Next for Datadog?
With Datadog’s IPO in 2019, what does the future hold for Datadog?
Being first to market coupled with their go-to-market strategy has helped Datadog grow tremendously [2]. But now the competition’s heating up. With Splunk’s acquisition of SignalFX, Splunk offers a fully observable solution that competes directly with Datadog. New Relic also developed their New Relic One platform which also competes with Datadog.
Along with Datadog enhancing its full observability solution, enterprise companies seem like the next logical target. They’ve also continued to expand their product offerings with products such as Security Monitoring, Continuous Profiler, and Network Monitoring.
Footnotes
- [1] Metric - Numeric representation of data measured over intervals of time. For example, a metric can tell you how much memory is being used by a specific process.
Log - Timestamped record of a discrete event. For instance, many user actions create a log: password change, login, login failures, renaming a file, etc.
Traces - A series of causally related distributed events that encode end-end request flow through a distributed system. For example, when I click on a video the trace can follow that action as it travels through the system. - [2] “We employ a land-and-expand business model centered around offering products that are easy to adopt and have a very short time to value. Our customers can expand their footprint with us on a self-service basis. Our customers often significantly increase their usage of the products they initially buy from us and expand their usage to other products we offer on our platform.” - Datadog S-1
Resources

